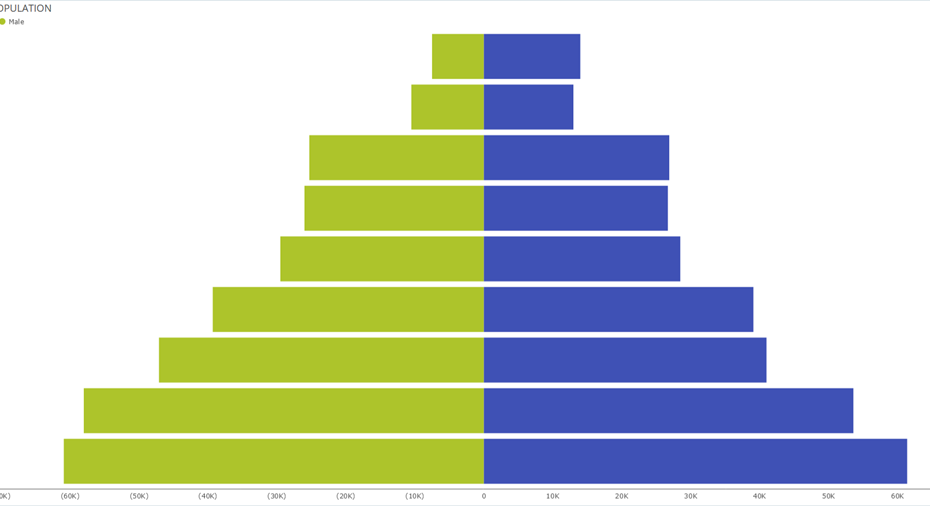
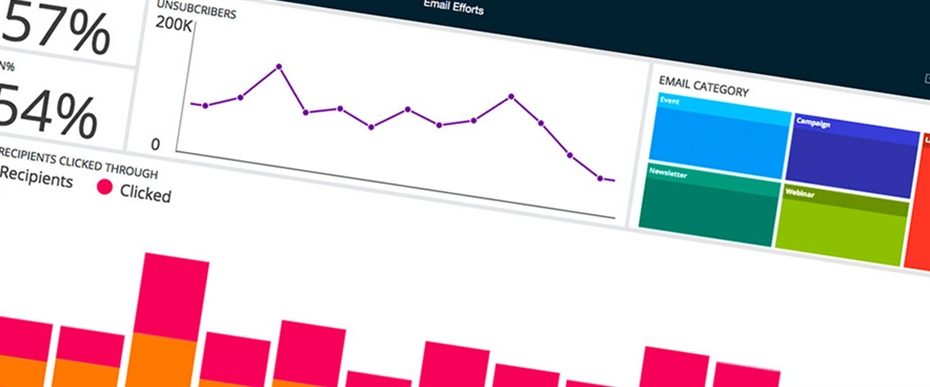
8 Ways to Improve Your Data Visualizations
在处理数据集时,请务必确保您的数据正确有效地呈现给受众,同时… 阅读更多 »8 Ways to Improve Your Data Visualizations
在处理数据集时,请务必确保您的数据正确有效地呈现给受众,同时… 阅读更多 »8 Ways to Improve Your Data Visualizations
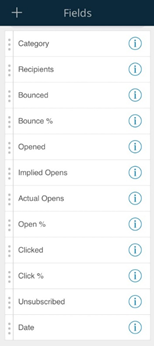
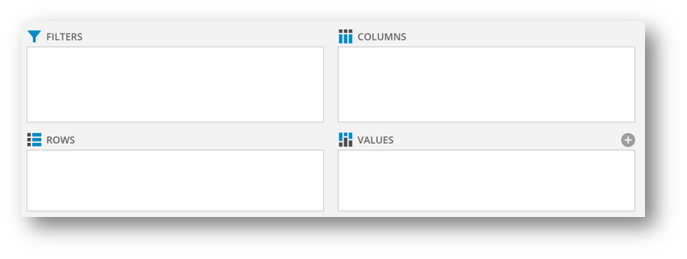
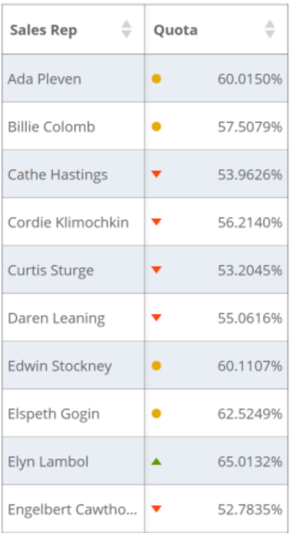
如果您一直在使用ReportPlus,您就会知道创建具有任意… 阅读更多 »Getting to Know the Widget Editor
正如你上个月看到的,我们最近获得了很多奖项,但其中一个突出的… 阅读更多 »Have You Checked Out Our Award Winning BI Software?
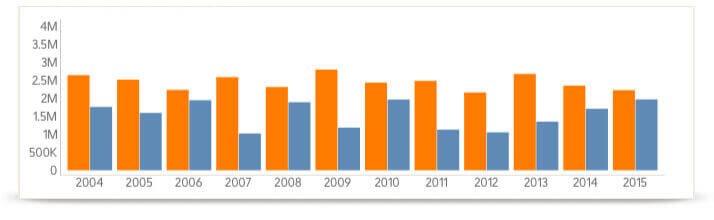
今天,我们指尖上的数据量可能是压倒性的。你怎么知道什么才是真… 阅读更多 »How to choose the best chart for your data
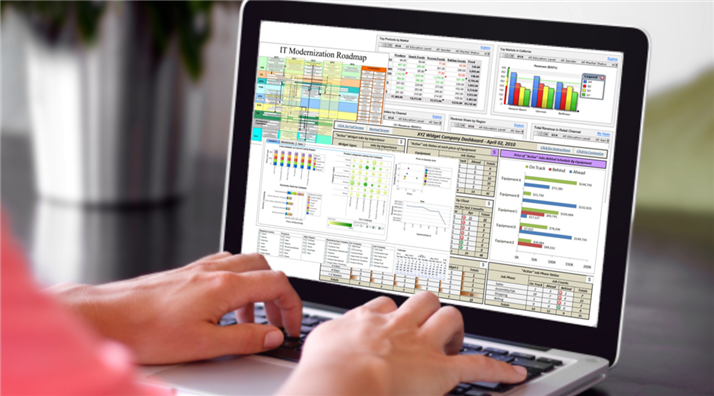
我们都看过那些仪表板。 当您需要包含来自不同部门的信息时,可… 阅读更多 »Building your Company’s 360 Dashboard with ReportPlus

在这个时代,用户正在寻找一个高价值的应用程序,其中包含所有内… 阅读更多 »How to Embed Analytics into Your WPF Project
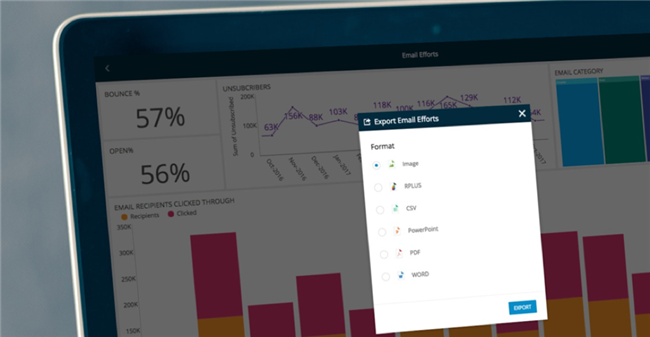
所以,最后,在这里! ReportPlus Server的5… 阅读更多 »ReportPlus Server: What’s new in version 5.4
我们很高兴地宣布ReportPlus Desktop 1.2… 阅读更多 »ReportPlus Desktop: What’s new in version 1.2.212