导言
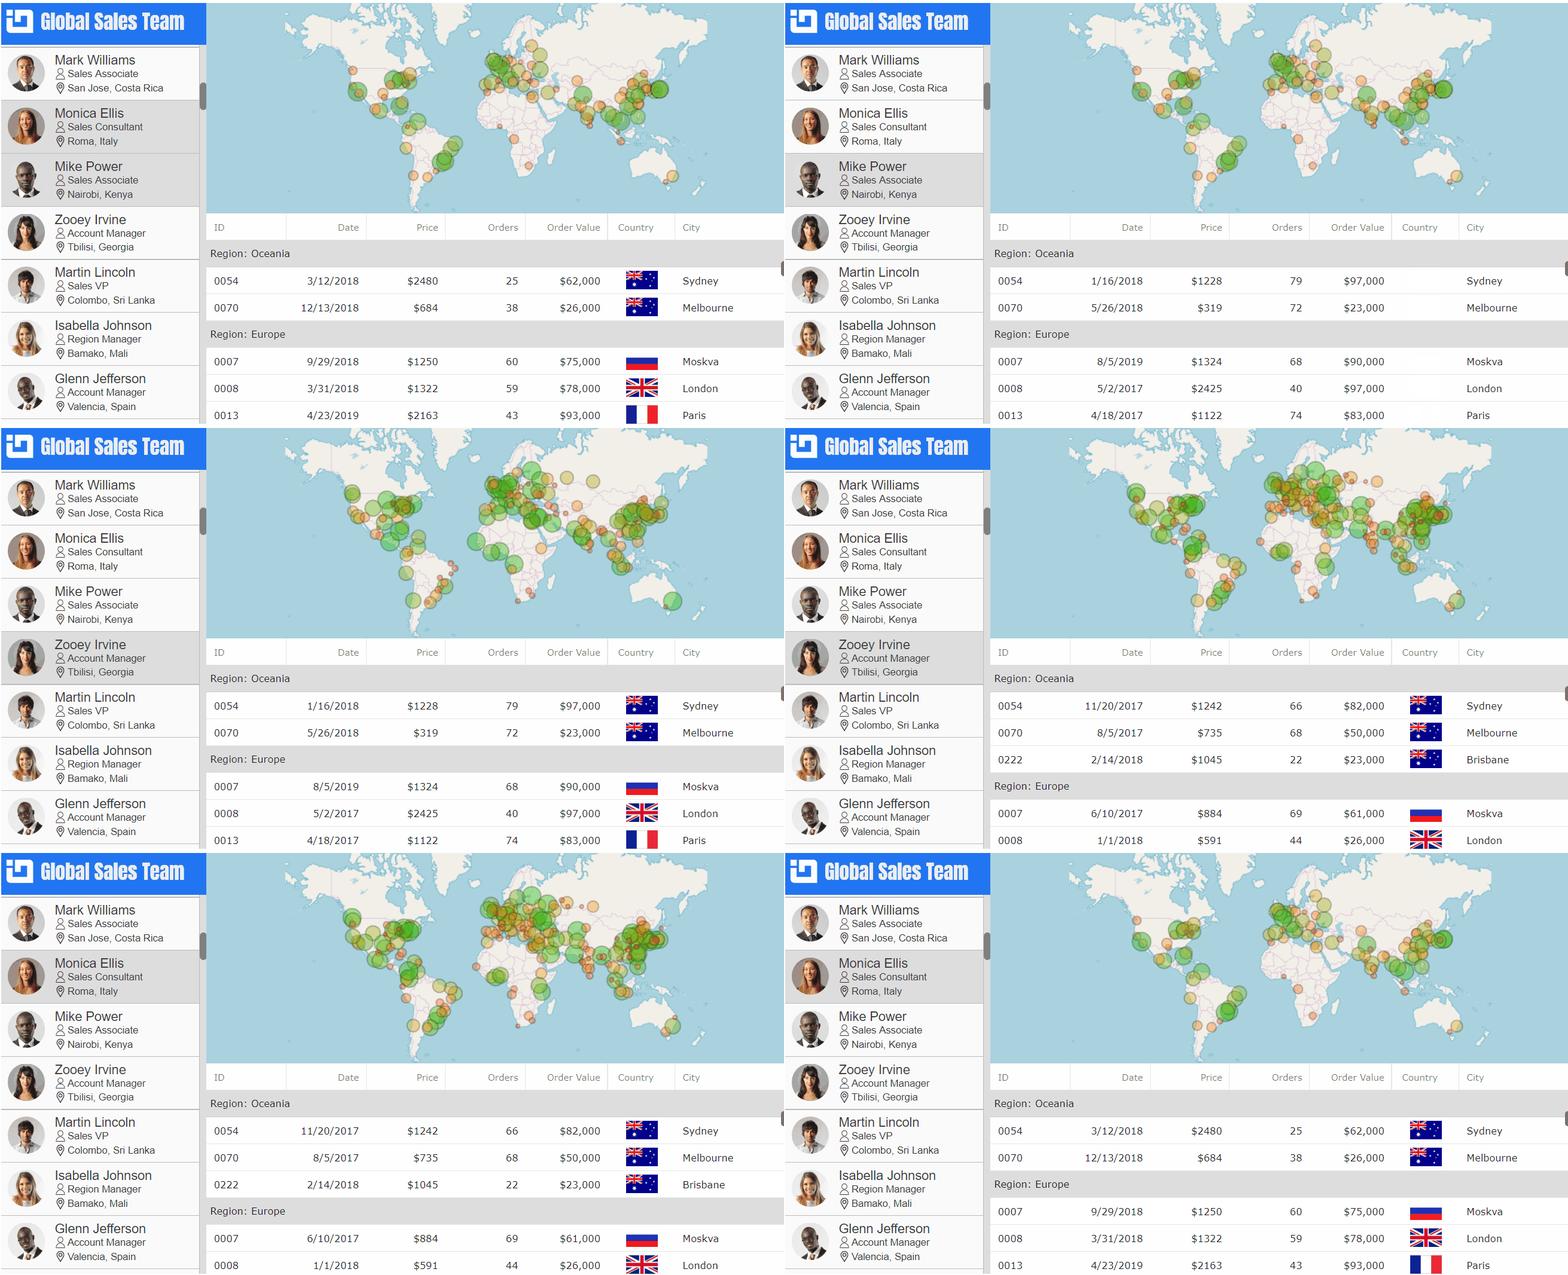
您是否曾经想创建一个主从应用程序或学习如何使用子集数据项可视化大型数据源?如果是这样,本博客文章将向您展示如何创建一个应用程序,该应用程序将可视化人员列表中的全球销售团队,React IgrGeographicMap组件中的销售位置以及React IgrLiveGrid组件中的销售详细信息。

请注意,上面的动画并不代表实际的应用程序,其中地图和网格组件更新速度非常快,新的数据为选定的人在销售团队。
主-细节视图设计是一种很好的数据可视化模式,用于呈现大型和复杂的数据集。顾名思义,主控-详图设计由两个视图组成: 主控视图和详图视图。母版视图通常是可选择的项目列表,如客户、团队成员、产品。详细视图显示母版视图中当前选定项目的数据。
母版视图
主视图是使用标准div、span、img和label组件构建的。

但是,首先我们需要为我们的应用程序生成数据源,并创建要在母版视图中显示的项目数组。
从 “../data/DataUtil” 导入DataUtil;

// 声明类中的字段: public
销售人员: any [];
public salesData: any [];
public salesList: JSX.Element[] = [];

// 生成数据和项目: 构造
(props: any) {
super (props);
这个 .Salespelers = DataUtil.getEmployees( 100 );
this .salesList = [];
为 (令i = 0; i < this .Salespelers.length; i ) {
const person = this .Salespelers [i];
this .salesList.push( this .renderItem(person, i));
}
}
接下来,我们可以创建母版视图并呈现销售列表的每个项目,如下所示。
<div className="masterView">
<div className="masterHeader">
<img src={this.getHeaderIcon()}/>
<标签>世界销售团队</标签>
</div>
<div className="主列表">
<div>{this.salesList}</div>
</div>
</div>
详图-视图
详细视图包含地图和网格组件,它们是Ignite Ui for React的一部分,您可以免费使用。
<div className="detailView">
<div className="地图"> </div>
<div className="网格"> </div>
</div>

IgrGeographicMap允许您在地理图像地图上显示包含您的数据中的地理位置的数据。
<div className="detailView">
<div className="地图">
<IgrGeographicMap
参考={this.onMapRef}
宽度="100%"
高度="100%"
可缩放="true">
<Igrgeographic比例符号系列
姓名="销售"
radiusScale={this.sizeScale}
fillScale={this.fillScale}
fillMemberPath="OrderValue"
radiusMemberPath="OrderValue"
latitudeMemberPath="Lat"
经度emberpath="Lon"
标记轮廓="rgba(0,0,0,0.2)"
markerType="圆"
tooltipTemplate={this.onSeriesTooltipCreate}/>
</IgrGeographicMap>
</div>
</div>

IgrLiveGrid是一个表格式React组件,允许您快速绑定和显示数据,而无需进行少量编码或配置。React数据网格的功能包括过滤,排序,模板,行选择,行分组,行固定和可移动列。
<div className="detailView">
<div className="网格">
<IgrLiveGrid
参考={this.onGridRef}
高度="100%"
宽度="100%"
rowHeight="35"
人头高度="35"
autoGenerateColumns="假">
<IgrTextColumn propertyPath="ID" 宽度="*>70"/>
<IgrDateTimeColumn propertyPath="OrderDate"
headerText="日期" 宽度="*>100" 水平对齐="右"/>
<IgrNumericColumn propertyPath="OrderPrice"
headerText="价格" 宽度="*>90" 正前缀="$" maxFractionDigits="0"/>
<IgrNumericColumn propertyPath="OrderCount"
headerText="订单" 宽度="*>80"/>
<IgrNumericColumn propertyPath="OrderValue"
& nbsp;headerText="订单值" 宽度="*>110" 正前缀="$"/>
<IgrImageColumn propertyPath="国家标志"
headerText="国家/地区" 水平对齐="中心" 宽度="90"/>
<IgrTextColumn propertyPath="城市" 宽度="*>150"/>
</IgrLiveGrid>
</div>
</div>
绑定视图
创建所有视图后,我们可以通过在主列表的单击事件中设置数据源来绑定它们。
public salesData: any [];

构造 (props: any (props) {
super (props);

此。salespeoples = DataUtil.getEmployees( 100 );

thit. // 默认为销售人员中的第一人。salesData = thit. salesPeople[ 0 ].sales;
}

public onGridRef(grid: IgrLiveGrid) {
thit. grid = grid;
this. grid.dataSource = this. salesData;
this. grid.flush();
this. grid.scrollToRowByIndex( 0 );
}

public onMapRef(map: igrGeographicMap) {
this .map = map;
this .map.dataSource = this .salesData;
this .map.Zoomgeographic ({左: -120 ,上: -30 ,宽度: 180 ,高度: 90 });
}

public onMasterItemClick (事件: React.MouseEvent) {
event.preventDefault();
const newId = event.currentTarget.id;
thism .salesData = thism .Sales [newId].Sales;

this. map.dataSource = this. salesData;
this. grid.dataSource = this. salesData;
this. grid.flush();
this. grid.scrollToRowByIndex( 0 );
}
最后的想法
上面的代码片段显示了在React应用程序中实现主从视图的最重要元素,该视图可视化了React IgrGeographicMap组件中的销售位置以及React IgrLiveGrid组件中的销售详细信息。
您可以从此GitHub存储库下载此应用程序的完整源代码。我希望你发现这篇博客很有趣,并受到启发,使用Ignite UI for React创建自己的主细节应用程序。
快乐编码,
马丁 </p